OpenTelemetry 追蹤
追蹤提供了 Prisma Client 執行活動(在操作級別)的詳細日誌,包括執行每個查詢所需的時間。它幫助你分析應用程式的效能並識別瓶頸。追蹤完全符合 OpenTelemetry,因此你可以將其作為端到端應用程式追蹤系統的一部分。
追蹤為你提供了 Prisma ORM 專案高度詳細、操作級別的洞察。如果你需要聚合的數字報告,例如查詢計數、連線計數和總查詢執行時間,請參閱指標。
關於追蹤
啟用追蹤後,Prisma Client 輸出以下內容:
- Prisma Client 執行的每個操作(例如 findMany)對應一個追蹤。
- 在每個追蹤中,包含一個或多個span。每個 span 代表操作一個階段所需的時間長度,例如序列化或資料庫查詢。Span 以樹狀結構表示,其中子 span 表示執行正在更大的父 span 內進行。
追蹤中 span 的數量和型別取決於追蹤所涵蓋的操作型別,但例如:
你可以將追蹤輸出傳送到控制檯,或者在任何相容 OpenTelemetry 的追蹤系統中分析它,例如 Jaeger、Honeycomb 和 Datadog。在本頁面上,我們提供了一個如何將追蹤輸出傳送到 Jaeger 的示例,你可以在本地執行它。
追蹤輸出
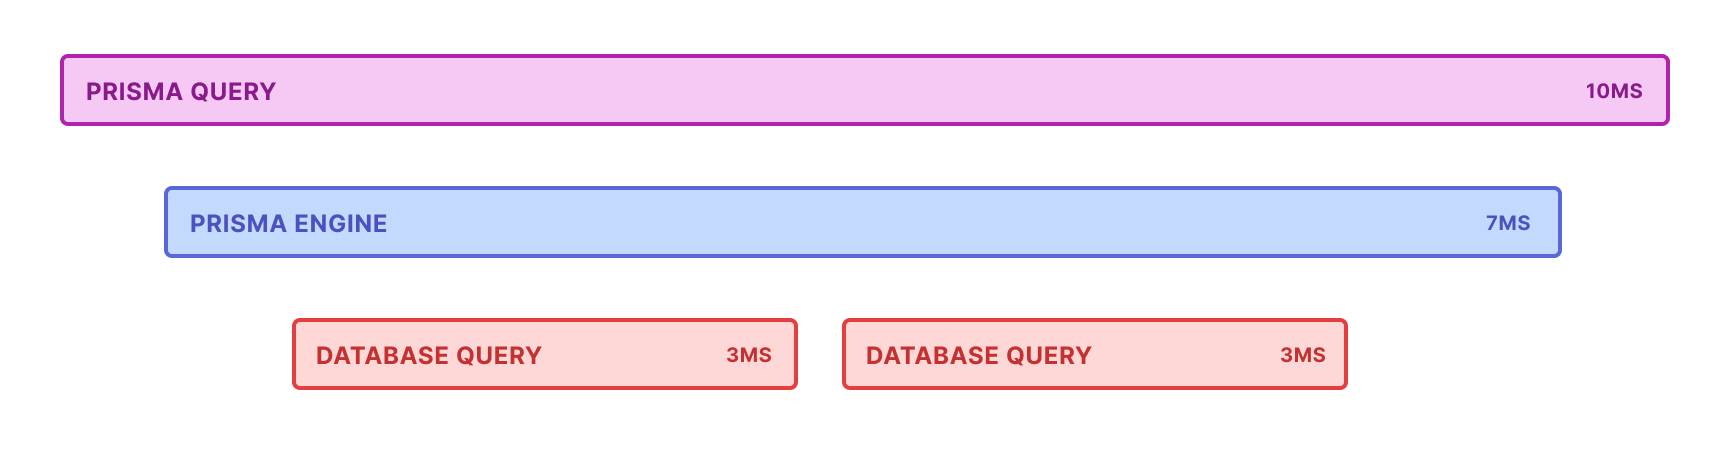
對於每個追蹤,Prisma Client 輸出一系列 span。這些 span 的數量和型別取決於 Prisma Client 操作。典型的 Prisma 追蹤包含以下 span:
prisma:client:operation:表示整個 Prisma Client 操作,從 Prisma Client 到資料庫再返回。它包含諸如 Prisma Client 呼叫模型和方法之類的詳細資訊。根據 Prisma 操作的不同,它包含以下一個或多個 span:prisma:client:connect:表示 Prisma Client 連線到資料庫所需的時間。prisma:client:serialize:表示驗證 Prisma Client 操作並將其轉換為查詢引擎的查詢所需的時間。prisma:engine:query:表示查詢引擎中查詢所需的時間。prisma:engine:connection:表示 Prisma Client 獲取資料庫連線所需的時間。prisma:engine:db_query:表示針對資料庫執行的資料庫查詢。它在標籤中包含查詢,以及查詢執行所需的時間。prisma:engine:serialize:表示將資料庫的原始響應轉換為型別化結果所需的時間。prisma:engine:response_json_serialization:表示將資料庫查詢結果序列化為 Prisma Client 的 JSON 響應所需的時間。
例如,給定以下 Prisma Client 程式碼:
prisma.user.findMany({
  where: {
    email: email,
  },
  include: {
    posts: true,
  },
})
追蹤結構如下:
prisma:client:operationprisma:client:serializeprisma:engine:queryprisma:engine:connectionprisma:engine:db_query:第一個 SQL 查詢或命令的詳細資訊...prisma:engine:db_query:...下一個 SQL 查詢或命令的詳細資訊...prisma:engine:serializeprisma:engine:response_json_serialization
注意事項和先決條件
如果你的應用程式向收集器傳送大量 span,這可能會對效能產生顯著影響。有關如何最小化此影響的資訊,請參閱減少效能影響。
要使用追蹤,你必須執行以下操作:
Prisma ORM 追蹤入門
本節解釋如何在應用程式中安裝和註冊追蹤。
步驟 1. 安裝最新的 Prisma ORM 依賴項
使用 prisma、@prisma/client 和 @prisma/instrumentation npm 包的 6.1.0 或更高版本。你還需要安裝 @opentelemetry/api 包,因為它是對等依賴項。
npm install prisma@latest --save-dev
npm install @prisma/client@latest --save
npm install @prisma/instrumentation@latest --save
npm install @opentelemetry/api@latest --save
Prisma ORM 早期版本的追蹤
追蹤在 Prisma ORM 4.2.0 版本中作為預覽功能新增。對於 4.2.0 到 6.1.0 之間的 Prisma ORM 版本,你需要在 Prisma schema 檔案中啟用 tracing 預覽功能。
generator client {
  provider        = "prisma-client-js"
  previewFeatures = ["tracing"]
}
步驟 2:安裝 OpenTelemetry 包
現在安裝相應的 OpenTelemetry 包,如下所示:
npm install @opentelemetry/semantic-conventions @opentelemetry/exporter-trace-otlp-http @opentelemetry/sdk-trace-base @opentelemetry/sdk-trace-node @opentelemetry/resources
步驟 3:在應用程式中註冊追蹤
以下程式碼提供了在 Prisma 中配置 OpenTelemetry 追蹤的兩個示例:
- 使用
@opentelemetry/sdk-trace-node(現有示例),它提供了對追蹤設定的細粒度控制。 - 使用
@opentelemetry/sdk-node,它提供了更簡單的配置,並與 OpenTelemetry 的 JavaScript 入門指南一致。
選項 1:使用 @opentelemetry/sdk-trace-node
此設定使你能夠對 Instrumentation 和追蹤進行細粒度控制。你需要為特定的應用程式定製此配置。這種方法簡潔,對於需要快速設定以將追蹤傳送到 OTLP 相容後端(如 Honeycomb、Jaeger 或 Datadog)的使用者來說更容易。
// Imports
import { ATTR_SERVICE_NAME, ATTR_SERVICE_VERSION } from '@opentelemetry/semantic-conventions'
import { OTLPTraceExporter } from '@opentelemetry/exporter-trace-otlp-http'
import { SimpleSpanProcessor } from '@opentelemetry/sdk-trace-base'
import { NodeTracerProvider } from '@opentelemetry/sdk-trace-node'
import { PrismaInstrumentation, registerInstrumentations } from '@prisma/instrumentation'
import { Resource } from '@opentelemetry/resources'

// Configure the trace provider
const provider = new NodeTracerProvider({
  resource: new Resource({
    [SEMRESATTRS_SERVICE_NAME]: 'example application', // Replace with your service name
    [SEMRESATTRS_SERVICE_VERSION]: '0.0.1', // Replace with your service version
  }),
})

// Configure how spans are processed and exported. In this case, we're sending spans
// as we receive them to an OTLP-compatible collector (e.g., Jaeger).
provider.addSpanProcessor(new SimpleSpanProcessor(new OTLPTraceExporter()))

// Register your auto-instrumentors
registerInstrumentations({
  tracerProvider: provider,
  instrumentations: [new PrismaInstrumentation()],
})

// Register the provider globally
provider.register()
這種方法提供了最大的靈活性,但可能涉及額外的配置步驟。
選項 2:使用 @opentelemetry/sdk-node
對於許多使用者,特別是初學者,NodeSDK 類透過將常見的預設值捆綁到單個統一配置中來簡化 OpenTelemetry 設定。
// Imports
import { OTLPTraceExporter } from '@opentelemetry/exporter-trace-otlp-proto'
import { NodeSDK } from '@opentelemetry/sdk-node'
import { PrismaInstrumentation } from '@prisma/instrumentation'

// Configure the OTLP trace exporter
const traceExporter = new OTLPTraceExporter({
  url: 'https://api.honeycomb.io/v1/traces', // Replace with your collector's endpoint
  headers: {
    'x-honeycomb-team': 'HONEYCOMB_API_KEY', // Replace with your Honeycomb API key or collector auth header
  },
})

// Initialize the NodeSDK
const sdk = new NodeSDK({
  serviceName: 'my-service-name', // Replace with your service name
  traceExporter,
  instrumentations: [
    new PrismaInstrumentation({
      middleware: true, // Enable middleware tracing if needed
    }),
  ],
})

// Start the SDK
sdk.start()

// Handle graceful shutdown
process.on('SIGTERM', async () => {
  try {
    await sdk.shutdown()
    console.log('Tracing shut down successfully')
  } catch (err) {
    console.error('Error shutting down tracing', err)
  } finally {
    process.exit(0)
  }
})
如果出現以下情況,請選擇 NodeSDK 方法:
- 你剛開始使用 OpenTelemetry,並希望簡化設定。
- 你需要以最少的樣板程式碼快速整合追蹤。
- 你正在使用像 Honeycomb、Jaeger 或 Datadog 這樣的 OTLP 相容追蹤後端。
如果出現以下情況,請選擇 NodeTracerProvider 方法:
- 你需要詳細控制 span 的建立、處理和匯出方式。
- 你正在使用自定義 span 處理器或匯出器。
- 你的應用程式需要特定的 Instrumentation 或採樣策略。
OpenTelemetry 具有高度可配置性。你可以自定義資源屬性、要被 Instrumentation 的元件、span 的處理方式以及 span 的傳送位置。
你可以在此示例應用程式中找到一個包含指標的完整示例。
追蹤操作指南
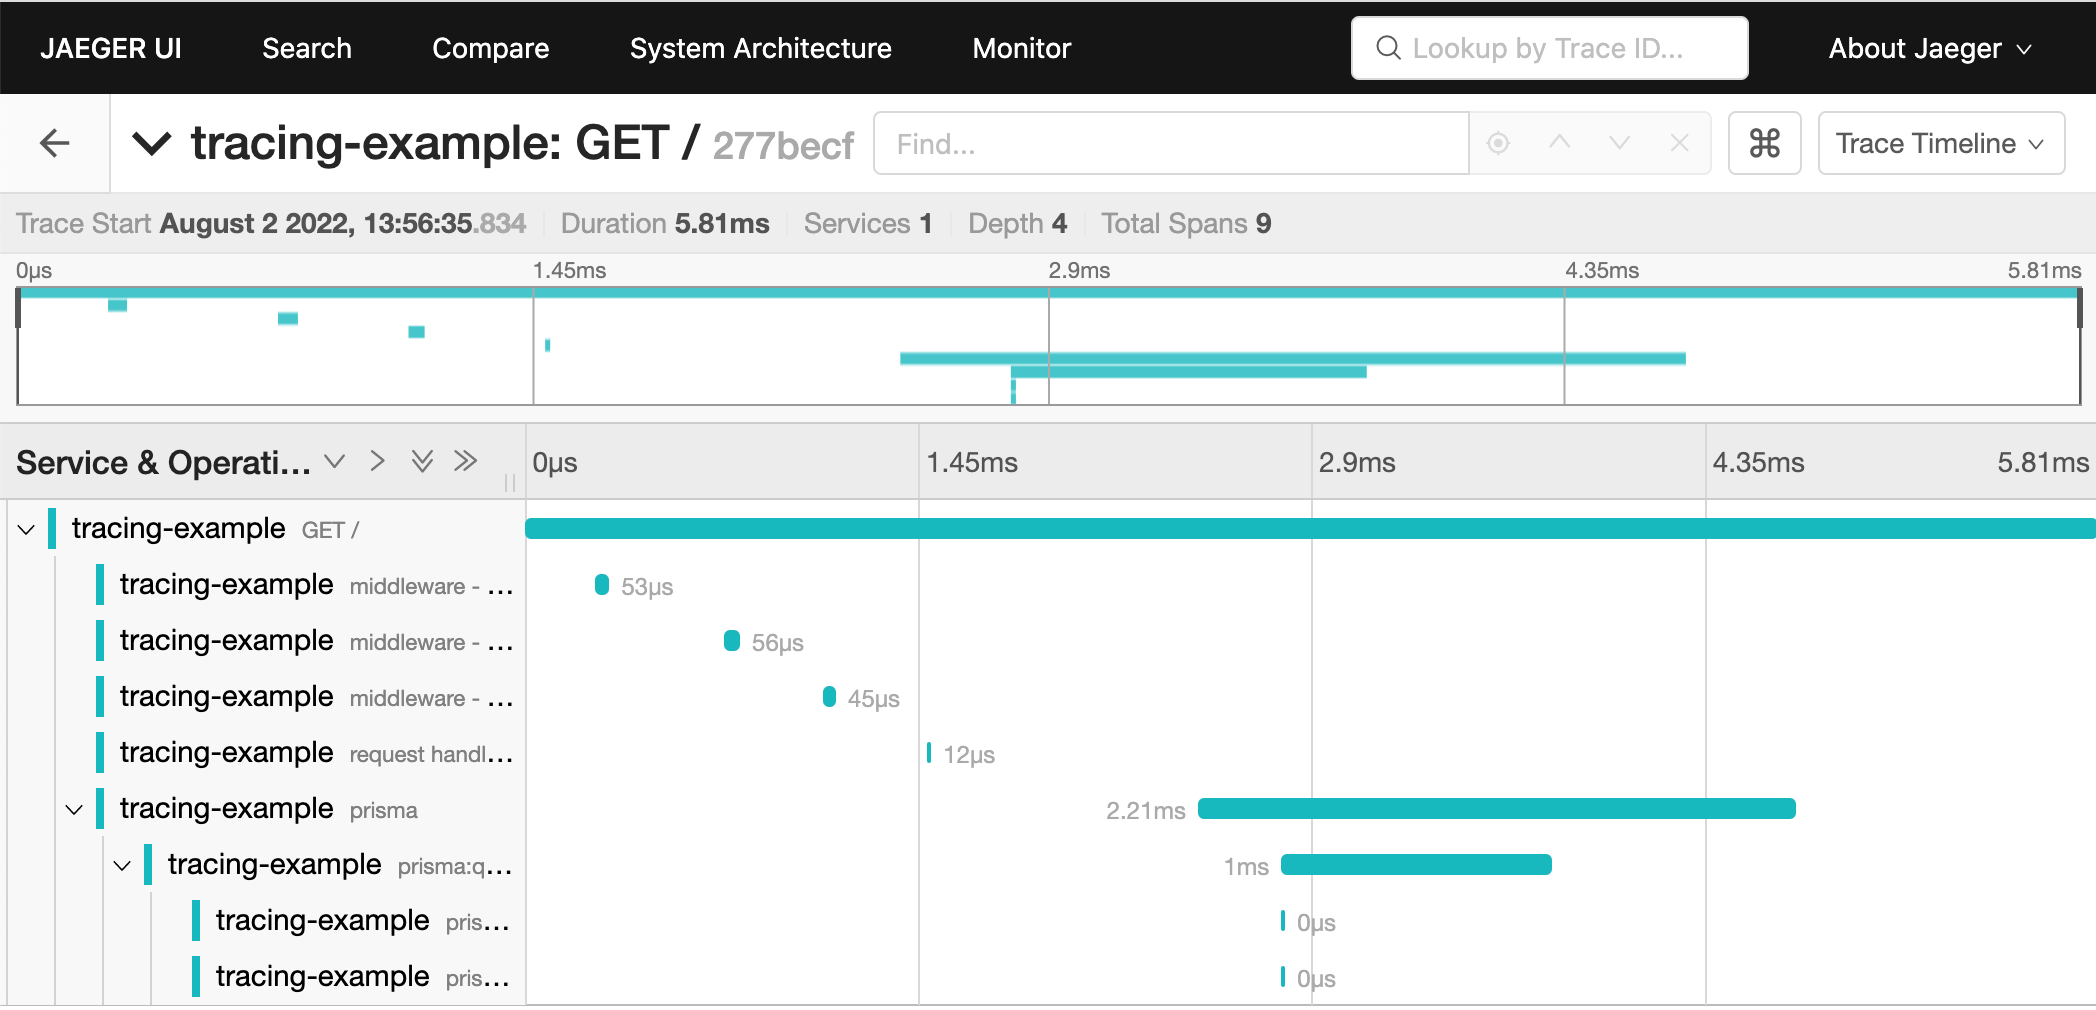
使用 Jaeger 視覺化追蹤
Jaeger 是一個免費的開源 OpenTelemetry 收集器和儀表板,你可以使用它來視覺化你的追蹤。
以下螢幕截圖顯示了一個示例追蹤視覺化:
要在本地執行 Jaeger,請使用以下 Docker 命令:
docker run --rm --name jaeger -d -e COLLECTOR_OTLP_ENABLED=true -p 16686:16686 -p 4318:4318 jaegertracing/all-in-one:latest
現在你可以在 https://:16686/ 找到追蹤儀表板。當你使用啟用了追蹤的應用程式時,你將開始在此儀表板中看到追蹤。
將追蹤輸出傳送到控制檯
以下示例使用 @opentelemetry/sdk-trace-base 中的 ConsoleSpanExporter 將輸出追蹤傳送到控制檯。
// Imports
import { SemanticResourceAttributes } from '@opentelemetry/semantic-conventions'
import {
  BasicTracerProvider,
  ConsoleSpanExporter,
  SimpleSpanProcessor,
} from '@opentelemetry/sdk-trace-base'
import { AsyncHooksContextManager } from '@opentelemetry/context-async-hooks'
import * as api from '@opentelemetry/api'
import { PrismaInstrumentation, registerInstrumentations } from '@prisma/instrumentation'
import { Resource } from '@opentelemetry/resources'

// Export the tracing
export function otelSetup() {
  const contextManager = new AsyncHooksContextManager().enable()

  api.context.setGlobalContextManager(contextManager)

  //Configure the console exporter
  const consoleExporter = new ConsoleSpanExporter()

  // Configure the trace provider
  const provider = new BasicTracerProvider({
    resource: new Resource({
      [SemanticResourceAttributes.SERVICE_NAME]: 'test-tracing-service',
      [SemanticResourceAttributes.SERVICE_VERSION]: '1.0.0',
    }),
  })

  // Configure how spans are processed and exported. In this case we're sending spans
  // as we receive them to the console
  provider.addSpanProcessor(new SimpleSpanProcessor(consoleExporter))

  // Register your auto-instrumentors
  registerInstrumentations({
    tracerProvider: provider,
    instrumentations: [new PrismaInstrumentation()],
  })

  // Register the provider
  provider.register()
}
追蹤 Prisma Client 中介軟體
預設情況下,追蹤不會為Prisma Client 中介軟體輸出 span。要將中介軟體包含在追蹤中,請在 registerInstrumentations 語句中將 middleware 設定為 true,如下所示:
registerInstrumentations({
  instrumentations: [new PrismaInstrumentation({ middleware: true })],
})
這將向你的追蹤新增以下 span 型別:
prisma:client:middleware:表示操作在你的中介軟體中花費的時間。
追蹤互動式事務
當你執行互動式事務時,除了標準 span 之外,你還會看到以下 span:
prisma:client:transaction:一個包裹prismaspan 的根 span。prisma:engine:itx_runner:表示互動式事務在查詢引擎中花費的時間。prisma:engine:itx_query_builder:表示構建互動式事務所需的時間。
例如,以下 Prisma schema:
generator client {
  provider        = "prisma-client-js"
}

datasource db {
  provider = "postgresql"
  url      = env("DATABASE_URL")
}

model User {
  id    Int    @id @default(autoincrement())
  email String @unique
}

model Audit {
  id     Int    @id
  table  String
  action String
}
給定以下互動式事務:
await prisma.$transaction(async (tx) => {
  const user = await tx.user.create({
    data: {
      email: email,
    },
  })

  await tx.audit.create({
    data: {
      table: 'user',
      action: 'create',
      id: user.id,
    },
  })

  return user
})
追蹤結構如下:
prisma:client:transactionprisma:client:connectprisma:engine:itx_runnerprisma:engine:connectionprisma:engine:db_queryprisma:engine:itx_query_builderprisma:engine:db_queryprisma:engine:db_queryprisma:engine:serialize
prisma:engine:itx_query_builderprisma:engine:db_queryprisma:engine:db_queryprisma:engine:serialize
prisma:client:operationprisma:client:serialize
prisma:client:operationprisma:client:serialize
新增更多 Instrumentation
OpenTelemetry 的一個好處是能夠透過對應用程式程式碼進行最少更改來新增更多 Instrumentation。
例如,要新增 HTTP 和 ExpressJS 追蹤,請將以下 instrumentations 新增到你的 OpenTelemetry 配置中。這些 instrumentations 為完整的請求-響應生命週期添加了 span。這些 span 顯示了你的 HTTP 請求花費了多長時間。
// Imports
import { ExpressInstrumentation } from '@opentelemetry/instrumentation-express'
import { HttpInstrumentation } from '@opentelemetry/instrumentation-http'

// Register your auto-instrumentors
registerInstrumentations({
  tracerProvider: provider,
  instrumentations: [
    new HttpInstrumentation(),
    new ExpressInstrumentation(),
    new PrismaInstrumentation(),
  ],
})
有關可用 instrumentations 的完整列表,請檢視 OpenTelemetry Registry。
自定義資源屬性
你可以透過更改資源屬性使其更具體地適用於你的應用程式,從而調整應用程式追蹤的分組方式:
const provider = new NodeTracerProvider({
  resource: new Resource({
    [SemanticResourceAttributes.SERVICE_NAME]: 'weblog',
    [SemanticResourceAttributes.SERVICE_VERSION]: '1.0.0',
  }),
})
目前正在努力標準化常用資源屬性。在可能的情況下,最好遵循標準屬性名稱。
減少效能影響
如果你的應用程式向收集器傳送大量 span,這可能會對效能產生顯著影響。你可以使用以下方法來減少此影響:
使用 BatchSpanProcessor 批次傳送追蹤
在生產環境中,你可以使用 OpenTelemetry 的 BatchSpanProcessor 以批次而不是一次一個的方式將 span 傳送到收集器。然而,在開發和測試期間,你可能不想批次傳送 span。在這種情況下,你可能更喜歡使用 SimpleSpanProcessor。
你可以配置你的追蹤配置,以便根據環境使用適當的 span 處理器,如下所示:
import {
  SimpleSpanProcessor,
  BatchSpanProcessor,
} from '@opentelemetry/sdk-trace-base'

if (process.env.NODE_ENV === 'production') {
  provider.addSpanProcessor(new BatchSpanProcessor(otlpTraceExporter))
} else {
  provider.addSpanProcessor(new SimpleSpanProcessor(otlpTraceExporter))
}
使用取樣向收集器傳送更少的 span
另一種減少效能影響的方法是使用機率取樣來向收集器傳送更少的 span。這降低了追蹤的收整合本,但仍然能很好地表示應用程式中發生的情況。
一個示例實現如下所示:
import { SemanticResourceAttributes } from '@opentelemetry/semantic-conventions'
import { NodeTracerProvider } from '@opentelemetry/sdk-trace-node'
import { TraceIdRatioBasedSampler } from '@opentelemetry/core'
import { Resource } from '@opentelemetry/resources'

const provider = new NodeTracerProvider({
  sampler: new TraceIdRatioBasedSampler(0.1),
  resource: new Resource({
    // we can define some metadata about the trace resource
    [SemanticResourceAttributes.SERVICE_NAME]: 'test-tracing-service',
    [SemanticResourceAttributes.SERVICE_VERSION]: '1.0.0',
  }),
})
追蹤故障排除
我的追蹤沒有顯示
你設定追蹤的順序很重要。在你的應用程式中,請確保在匯入任何被 Instrumentation 的依賴項之前註冊追蹤和 Instrumentation。例如:
import { registerTracing } from './tracing'

registerTracing({
  name: 'tracing-example',
  version: '0.0.1',
})

// You must import any dependencies after you register tracing.
import { PrismaClient } from '@prisma/client'
import async from 'express-async-handler'
import express from 'express'